Ever wondered what makes a great deal feel so good? Or how businesses profit while still delivering value to their customers? The answers lie in two fundamental economic concepts: consumer surplus and producer surplus. These ideas help us understand the benefits that both buyers and sellers gain from market transactions, illustrating the efficiency and welfare generated by a functioning market.
Let’s dive in and explore these concepts, supported by visual representations that bring them to life.
The Sweet Deal for Buyers: Consumer Surplus
Imagine you’re at a market, ready to buy a new gadget. You’ve set a mental limit: you’re willing to pay up to $100 for it. You browse around and, to your delight, find the exact gadget for only $70! That $30 difference isn’t just savings; it’s your consumer surplus.
Consumer surplus is the difference between the maximum price a consumer is willing to pay for a good or service and the actual price they pay. It represents the extra benefit or utility consumers receive from purchasing a good at a price lower than what they were prepared to pay.
Think of it as the “bargain” feeling. Every consumer has a different willingness to pay, based on their individual preferences, income, and needs. When the market price is lower than their personal maximum, they gain consumer surplus.
Visualizing Consumer Surplus
To truly grasp this, let’s look at a demand curve:
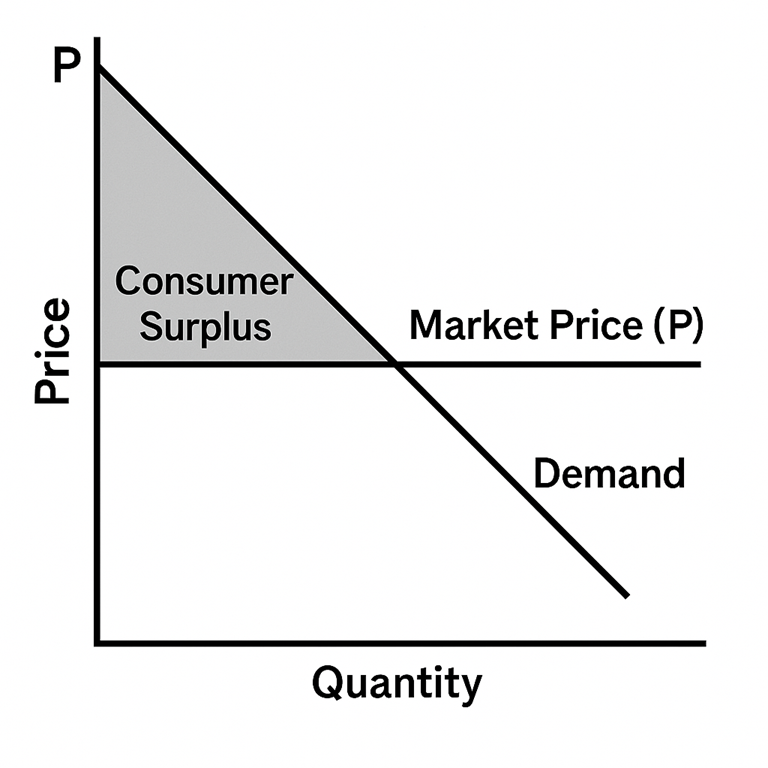
Explanation of the Graph:
- Demand Curve (D): This curve shows the quantity of a good consumers are willing and able to buy at various prices. It slopes downwards because as the price falls, consumers are generally willing to buy more.
- Market Price (P*): This is the actual price at which the good is sold in the market.
- Consumer Surplus Area: The shaded triangular area above the market price and below the demand curve represents the total consumer surplus in the market. Each point on the demand curve above the market price indicates a consumer who was willing to pay more than P*, and thus gains surplus. The sum of these individual surpluses forms the total consumer surplus for the market.
The Profit for Sellers: Producer Surplus
Now, let’s flip to the other side of the transaction. Consider a company that manufactures that same gadget. They have various costs: raw materials, labor, electricity, etc. They’re willing to sell the gadget as long as the price covers their production costs and provides a reasonable profit. Let’s say their minimum acceptable price to produce and sell one gadget is $50. If they manage to sell it for $70, they gain $20. This $20 is their producer surplus.
Producer surplus is the difference between the actual price a producer receives for a good or service and the minimum price they would have been willing to accept to produce and sell it. It represents the extra benefit or profit producers gain by selling at a market price higher than their minimum supply price.
The minimum price a producer is willing to accept is typically determined by their marginal cost of production – the cost of producing one additional unit.
Visualizing Producer Surplus
To understand producer surplus, we turn to a supply curve:
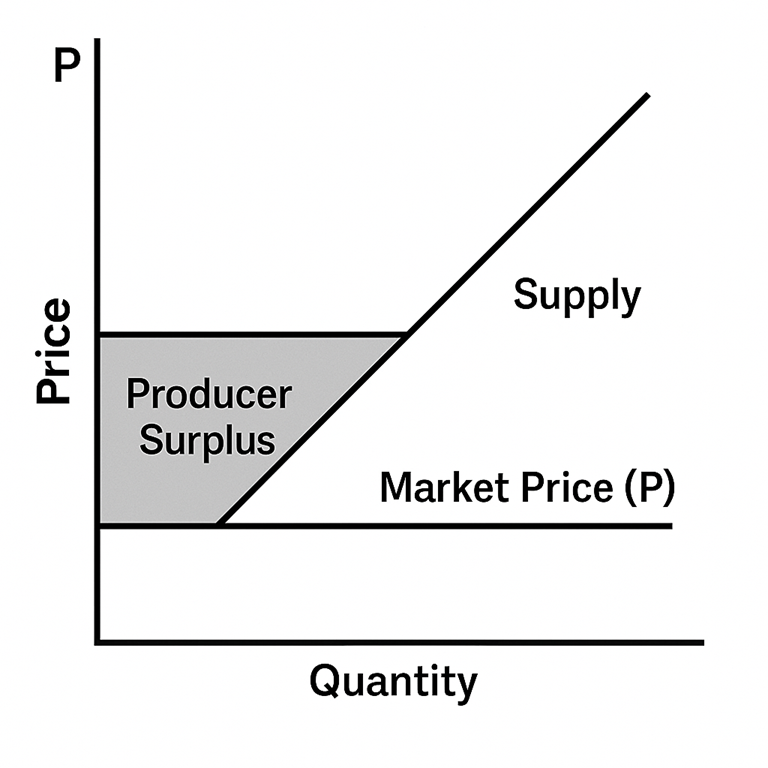
Explanation of the Graph:
- Supply Curve (S): This curve shows the quantity of a good producers are willing and able to sell at various prices. It slopes upwards because as the price increases, producers are generally willing to supply more (as higher prices cover higher production costs and offer greater profit potential).
- Market Price (P*): This is the actual price at which the good is sold in the market.
- Producer Surplus Area: The shaded triangular area below the market price and above the supply curve represents the total producer surplus in the market. Each point on the supply curve below the market price indicates a producer who was willing to sell for less than P*, and thus gains surplus. The sum of these individual surpluses forms the total producer surplus for the market.
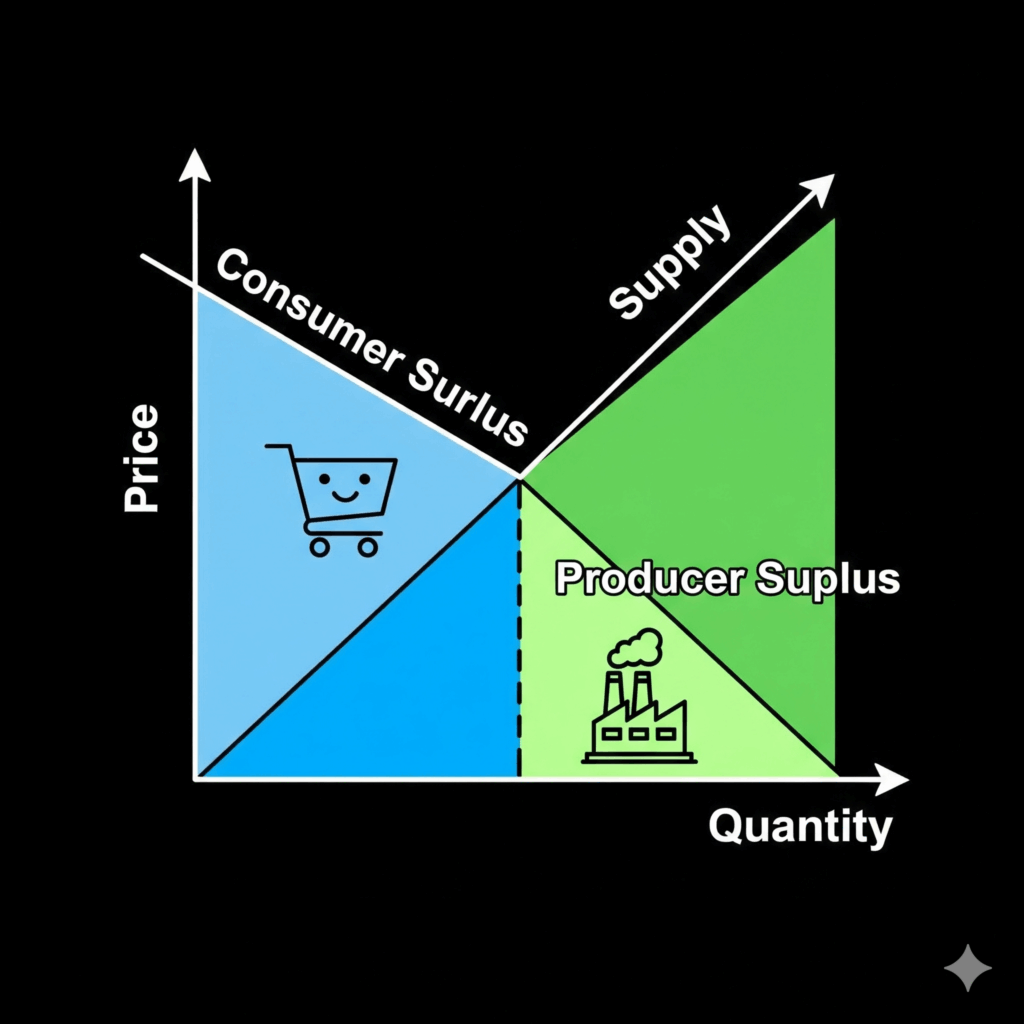
The Power of Equilibrium: Total Surplus
When a market operates efficiently, it reaches an equilibrium point where the quantity demanded equals the quantity supplied. At this point, both consumer and producer surplus are maximized, leading to the greatest overall welfare for society. The sum of consumer surplus and producer surplus is known as total surplus or social welfare.
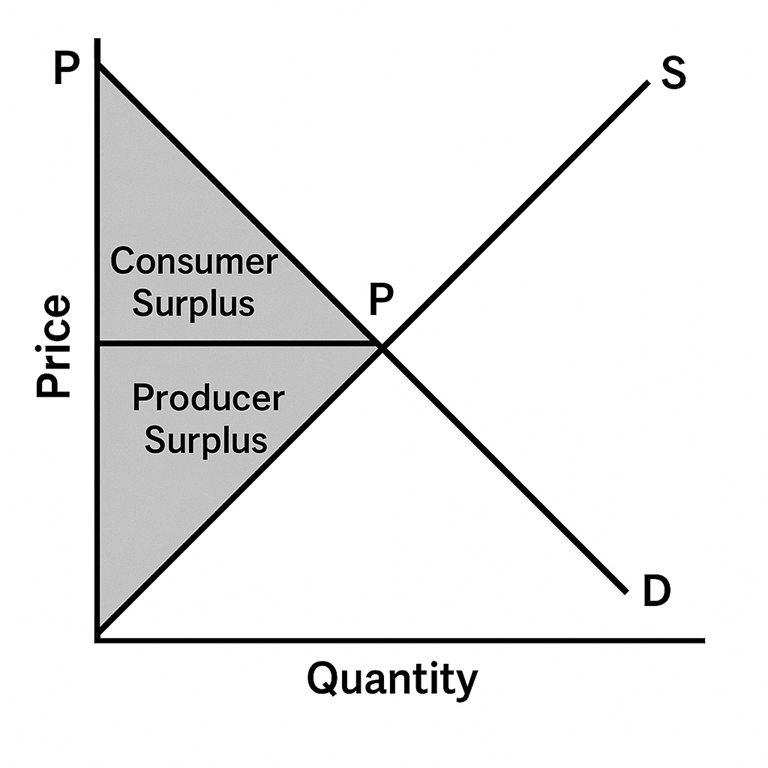
Explanation of the Graph:
- Equilibrium (E): The point where the supply and demand curves intersect. At this point, the market “clears,” meaning the quantity consumers want to buy exactly matches the quantity producers want to sell.
- Total Surplus: The entire shaded area (both consumer and producer surplus combined) represents the total economic welfare generated by the market at equilibrium. This illustrates that voluntary exchange in a free market benefits both buyers and sellers, creating mutual gains.
Why Does This Matter?
Understanding consumer and producer surplus is crucial for several reasons:
- Market Efficiency: It demonstrates how free markets, left to their own devices, tend to allocate resources efficiently, maximizing the benefits for both buyers and sellers.
- Impact of Government Intervention: Policies like taxes, subsidies, price ceilings, or price floors can affect market prices and quantities, thereby altering the distribution and size of consumer and producer surplus. Often, such interventions can lead to a reduction in total surplus, known as “deadweight loss.”
- Welfare Analysis: Economists use these concepts to analyze the overall welfare implications of different policies and market conditions.
In essence, consumer and producer surplus are powerful tools that reveal the hidden value and efficiency inherent in everyday market transactions. They remind us that when you find a good deal, you’re not just saving money – you’re a participant in a mutually beneficial exchange that generates value for everyone involved.