Could a typical U.S. home really cost $1 million by 2050? It sounds like a headline designed to make everyone put down their coffee. Yet it is a serious long-range projection now being discussed by housing economists. National Association of REALTORS(R) Chief Economist Lawrence Yun recently said the national median home price could reach $1 million around 2050. That would arrive as many millennials approach retirement age, turning an already emotional housing conversation into a generational one.
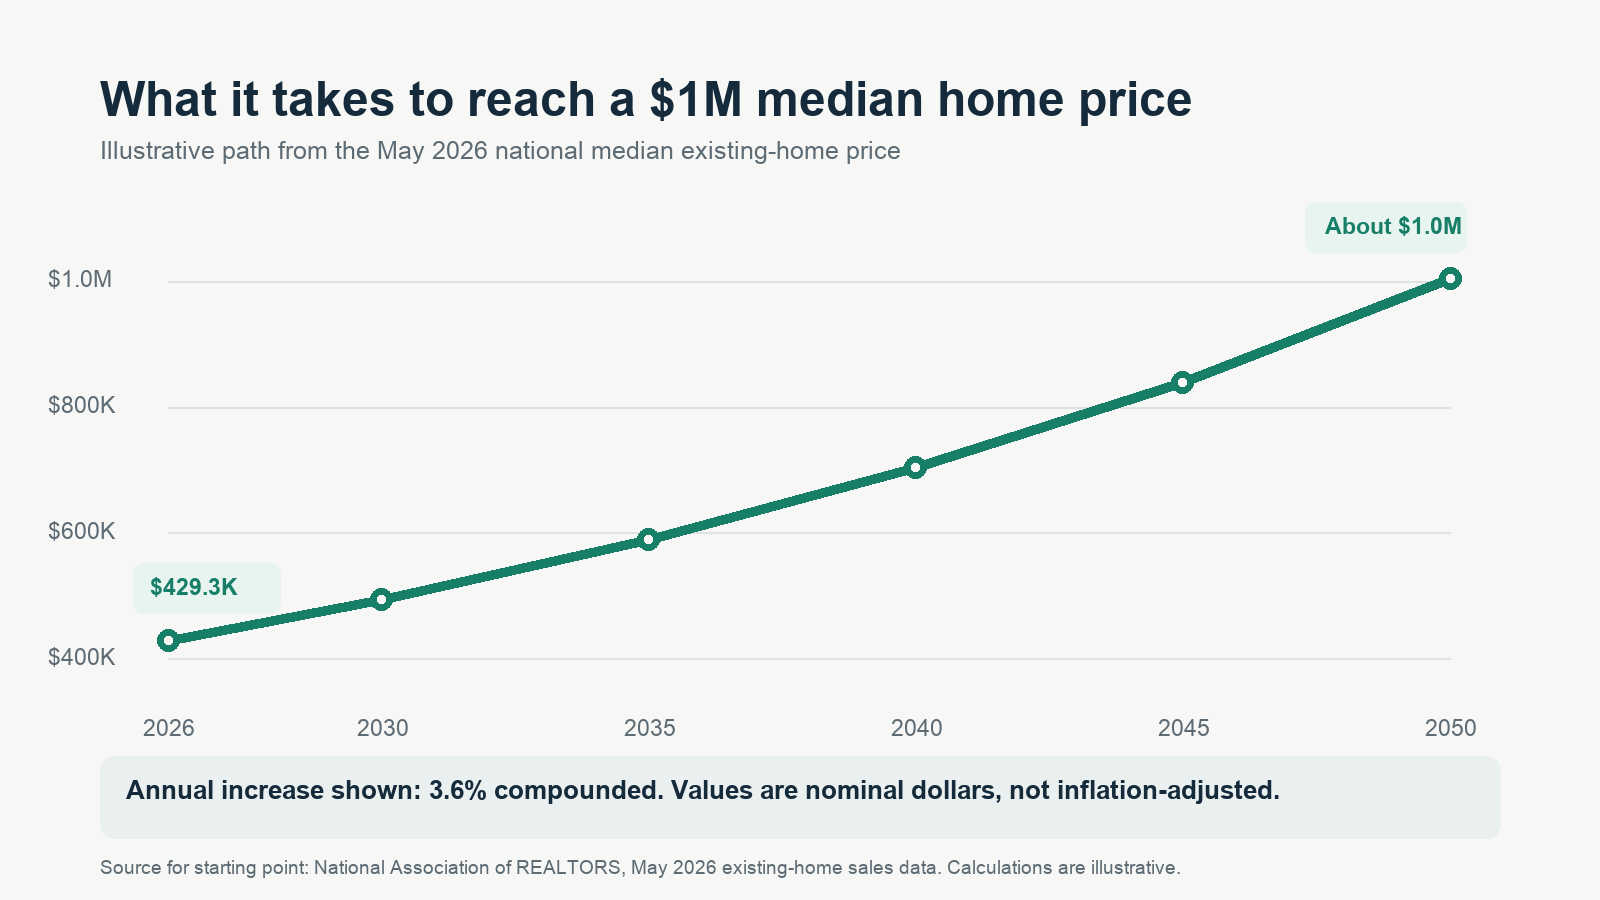
The important word here is could. This is not a promise, a calendar reminder, or a prediction that every bungalow in every town will carry a seven-figure price tag. It is a nominal-dollar projection based on a long runway of price growth, constrained supply, household demand, and the basic power of compounding. The national median existing-home price was $429,300 in May 2026. A move from there to roughly $1 million by 2050 would require about 3.6% annual appreciation. That is a meaningful pace, but it is not a wild mathematical leap.
So what would a $1 million median home price actually mean for buyers, owners, renters, and communities? And what could change the journey between now and 2050? Let’s unpack the idea without treating the future like a foregone conclusion.

Why a $1 million national median is mathematically possible
One million dollars is a psychologically enormous number. In housing, though, the more useful question is not whether the number feels big. It is what annual growth rate gets us there. Starting with a $429,300 national median, 3.6% annual appreciation produces roughly $1.0 million in 24 years. That is the quiet force of compounding: a modest percentage repeated many times becomes a large dollar figure.
For context, U.S. home prices do not rise in a smooth straight line. Some years bring bidding wars; others bring price cuts, higher mortgage rates, or recessions. Local markets can behave very differently from the national figures. But a long-term projection is not saying every year will be 3.6%. It is saying the average pace over many years could land around that neighborhood.
That is also why the $1 million figure should be described carefully. It refers to the national median, meaning half of transactions would be above the level and half below it. It is not the average value of every home, it does not tell us the price in a particular county, and it does not mean every first-time buyer will be shopping at that price point. A small town with ample land and new construction may stay far below the national median, while high-cost coastal markets could be well above it.
Nominal dollars are not today’s dollars
This is the caveat that deserves to be in every conversation about a million-dollar home in 2050. A dollar in 2050 will not buy what a dollar buys today. If inflation averaged 2.5% a year from 2026 through 2050, $1 million in 2050 would have purchasing power similar to roughly $550,000 today. That is still a hefty figure, but it is a very different statement from saying today’s $1 million home becomes the national norm in real, inflation-adjusted terms.
That distinction does not make affordability worries disappear. Households do not buy houses with an inflation footnote. They buy them with paychecks, down payments, and monthly mortgage payments. The key question is whether income growth keeps pace with home prices and financing costs. If wages, productivity, and housing supply improve alongside nominal prices, the pressure may be manageable for more people. If prices outpace incomes, the same headline becomes a warning about access to ownership.
Mortgage rates matter too. A buyer can sometimes handle a higher price when borrowing costs are lower, and a lower-priced house can feel punishing when rates jump. That is why a price forecast alone cannot predict affordability. It needs to be read beside household income, local taxes and insurance, mortgage rates, and the amount of homes available for sale.
The supply story underneath the headline
Housing prices are not driven by a single switch. Still, supply is the stubborn thread running through most of the story. When a growing number of households want to live near jobs, schools, family, transit, or amenities and the number of available homes does not keep up, prices tend to face upward pressure. The result can be more competition for the same homes, fewer move-up options for existing owners, and a market that feels frozen even when demand cools.
Builders have made progress in some places, but construction faces land costs, permitting delays, labor shortages, material prices, financing conditions, and neighborhood rules. The Congressional Budget Office’s long-run outlook projects housing starts to average 1.1 million per year from 2034 to 2043 and 0.8 million per year from 2044 to 2053 in its baseline. That does not tell us precisely what prices will do, but it underscores why construction, demographics, and policy will remain central variables rather than background noise.
New construction also has its own complicated signals. The Census Bureau reported a $422,500 median price for new houses sold in April 2026, while the stock of new homes for sale was relatively large. Builders can respond to demand by changing home sizes, offering incentives, or producing in lower-cost locations. Those choices affect the mix of housing people can actually buy, not just the total number of rooftops.
In short: a $1 million median is easier to imagine in a country that continues to underbuild in high-demand areas than in one that makes it faster and more practical to add a wide range of homes. Duplexes, townhomes, small apartments near transit, accessory dwellings, modular construction, and starter-home lots are not glamorous policy language. They are part of the math.
One country, many housing markets
National numbers are useful for understanding direction, but no one buys the national housing market. They buy a block, a school district, a commute, a climate, and a set of local trade-offs. The same 2050 could contain a cooling market where population growth slows, a fast-growing Sun Belt metro with substantial new building, and a land-constrained job center where prices stay intensely competitive.
That is why readers should resist two equal and opposite mistakes. The first is assuming every market must race to $1 million because the national median might. The second is assuming a modest local price trend means national affordability pressures are imaginary. Both can be true: a buyer in one region may see choices improving while renters and first-time buyers in another face a much steeper climb.
The current near-term outlook is also more measured than the 2050 headline. Realtor.com’s 2026 forecast called for 2.2% existing-home median price appreciation, 6.3% average mortgage rates, and higher inventory. That is a useful reminder that a long-term scenario can coexist with a calmer year. Housing markets breathe in chapters, not just headlines.
How to read a 2050 housing forecast
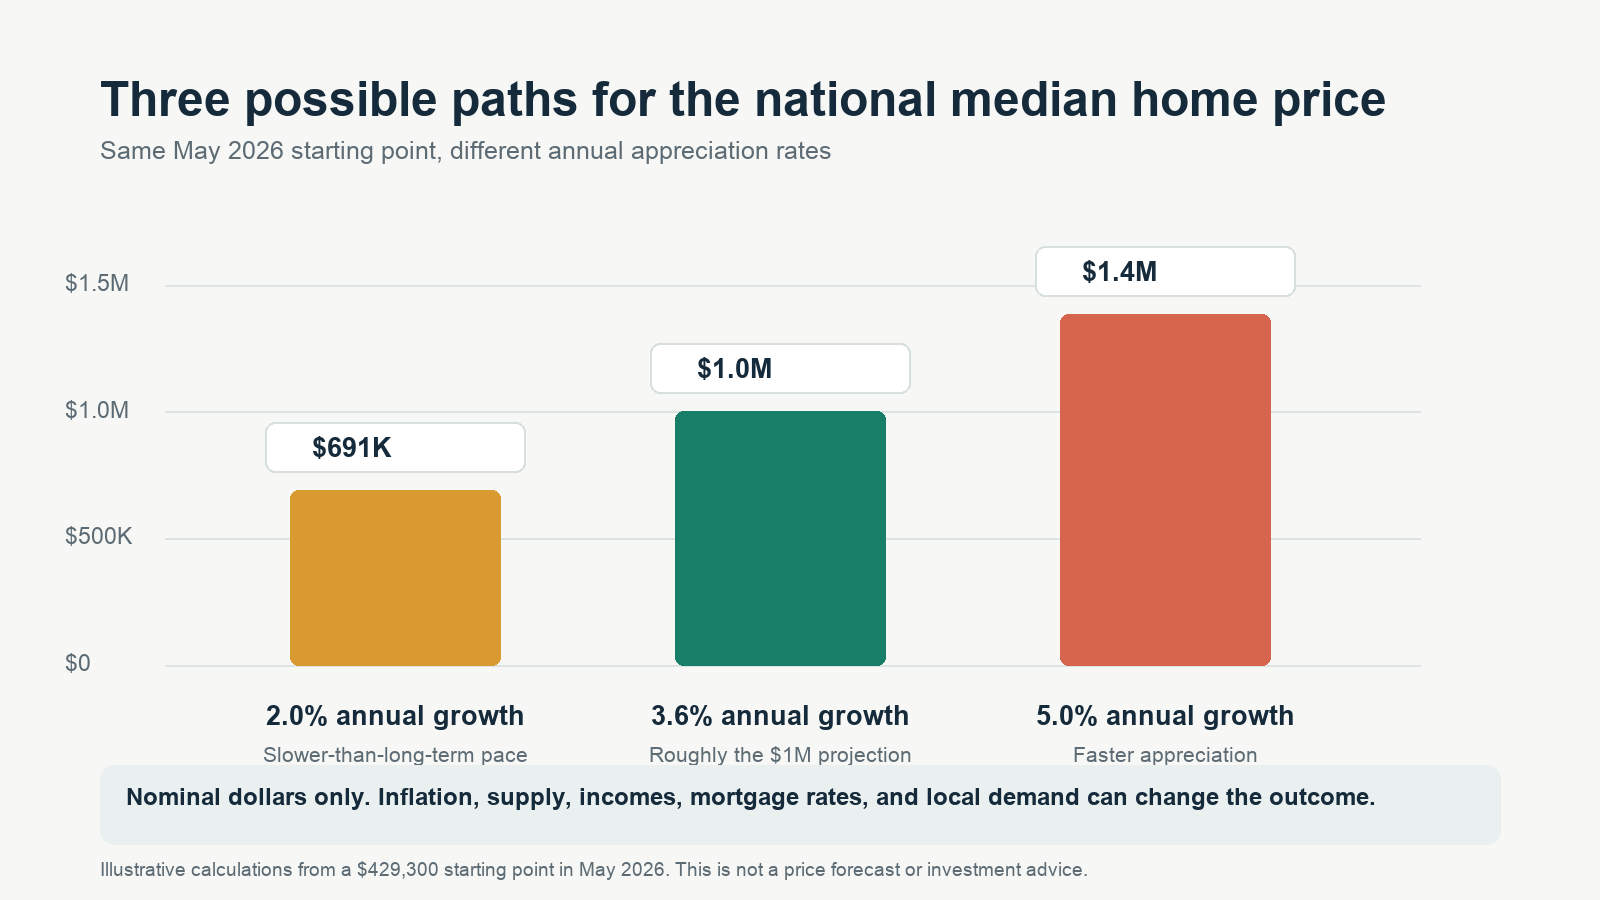
Long-range forecasts are most useful as a way to test assumptions, not as a bet on one exact number. The $1 million projection asks us to imagine a 3.6% average annual climb from the current national median. That is one reasonable path, not the only possible path. At 2% annual growth, the same starting point reaches about $691,000 by 2050. At 5%, it reaches roughly $1.39 million. A seemingly small difference in the rate creates a very large difference at the finish line.
That is why the right response is curiosity rather than certainty. Ask what is doing the work in any projection. Is it assuming steady inflation? Persistent scarcity? Faster household income growth? Migration toward particular metros? Stable borrowing conditions? A forecast with transparent assumptions can be useful even when the eventual price is wrong, because it tells us which forces deserve attention.
It is also worth remembering what a median sales price measures. It moves not only because individual homes gain or lose value, but because the mix of homes sold changes. A month with more luxury-home transactions can raise the median, while a surge in entry-level construction can pull it down. Over decades, that composition effect matters. The clearest takeaway is directional: building enough homes across price points matters at least as much as watching a single national number.
Who may feel the biggest effects?
First-time buyers will likely feel the headline most directly. Higher prices can mean more years needed to save, larger down payments, more help from family, smaller homes, longer commutes, or a longer stretch in rental housing. For renters, the issue is often not simply missing an investment opportunity. It is the loss of choice that comes when ownership gets farther away while rents also absorb more of a household budget.
Existing owners have a more mixed picture than the usual “prices up, everyone wins” story suggests. Rising equity can improve financial security and make a future sale more valuable. But it can also make moving harder, raise property taxes and insurance, and create an awkward trade: sell high, then buy high. Owners hoping to downsize or relocate may not feel like they have won a simple lottery ticket.
Communities face their own version of the puzzle. When essential workers cannot live near their jobs, employers struggle to hire, traffic grows, local businesses lose staff, and schools and services feel the strain. A healthy housing market is not just about rising asset values. It is about whether people at different life stages and income levels can build stable lives in the same community.
What could bend the path before 2050?
Plenty of things. More housing construction in the places people want to live could reduce price pressure. Faster productivity and income growth could improve the affordability side of the equation. Lower mortgage rates might help payments while also boosting demand. Higher rates, a recession, climate risks, insurance costs, demographic shifts, migration patterns, or a wave of building in new areas could all reshape local outcomes.
Policy choices are especially important because they influence what gets built and where. Zoning reform, faster approvals, infrastructure investment, rehabilitation of older homes, and support for different forms of ownership can alter the supply picture over time. None is a magic wand. But treating housing scarcity as inevitable is also a choice, just a quieter one.
There is another healthy dose of humility required. A 24-year projection spans business cycles, elections, technological changes, and events nobody can see from here. The sensible way to use it is not as a reason to panic-buy or declare the market permanently broken. It is a prompt to ask better questions: Are we building enough? Are incomes keeping up? Which local rules are helping or hurting? What kind of housing is missing?
The practical takeaway for households
If you are hoping to buy, focus on the variables you can actually influence: savings rate, debt, credit, location flexibility, and a realistic monthly payment. Do not let a distant headline push you into a home that strains your budget today. A plan that leaves room for repairs, taxes, insurance, and ordinary life is more valuable than winning a race against an uncertain projection.
If you already own, rising values are a reason to understand your equity and your long-term options, not necessarily a reason to assume future gains are guaranteed. Review insurance, maintenance, local tax exposure, and the cost of your next move. The strongest housing decisions are still the boringly useful ones: buy for a need you can sustain, avoid overextending, and understand your local market.
The possibility of a $1 million national median by 2050 is less a crystal-ball answer than a spotlight. It highlights how 3.6% annual growth can compound, how nominal and real prices differ, and how deeply housing supply shapes everyday opportunity. The future price tag is uncertain. The need for more housing choices, clearer affordability math, and patient long-term thinking is not.
This article is for general information and is not financial, legal, or investment advice.